Dashboard overview
Dashboard is one part of the PEACH project which allows to collect and visualize metrics about recommendation system. It can be generic metrics like number of collected events, or more business oriented to evaluate different recommendation algorithms, for example, click-through rate or diversity of recommended content.
Components

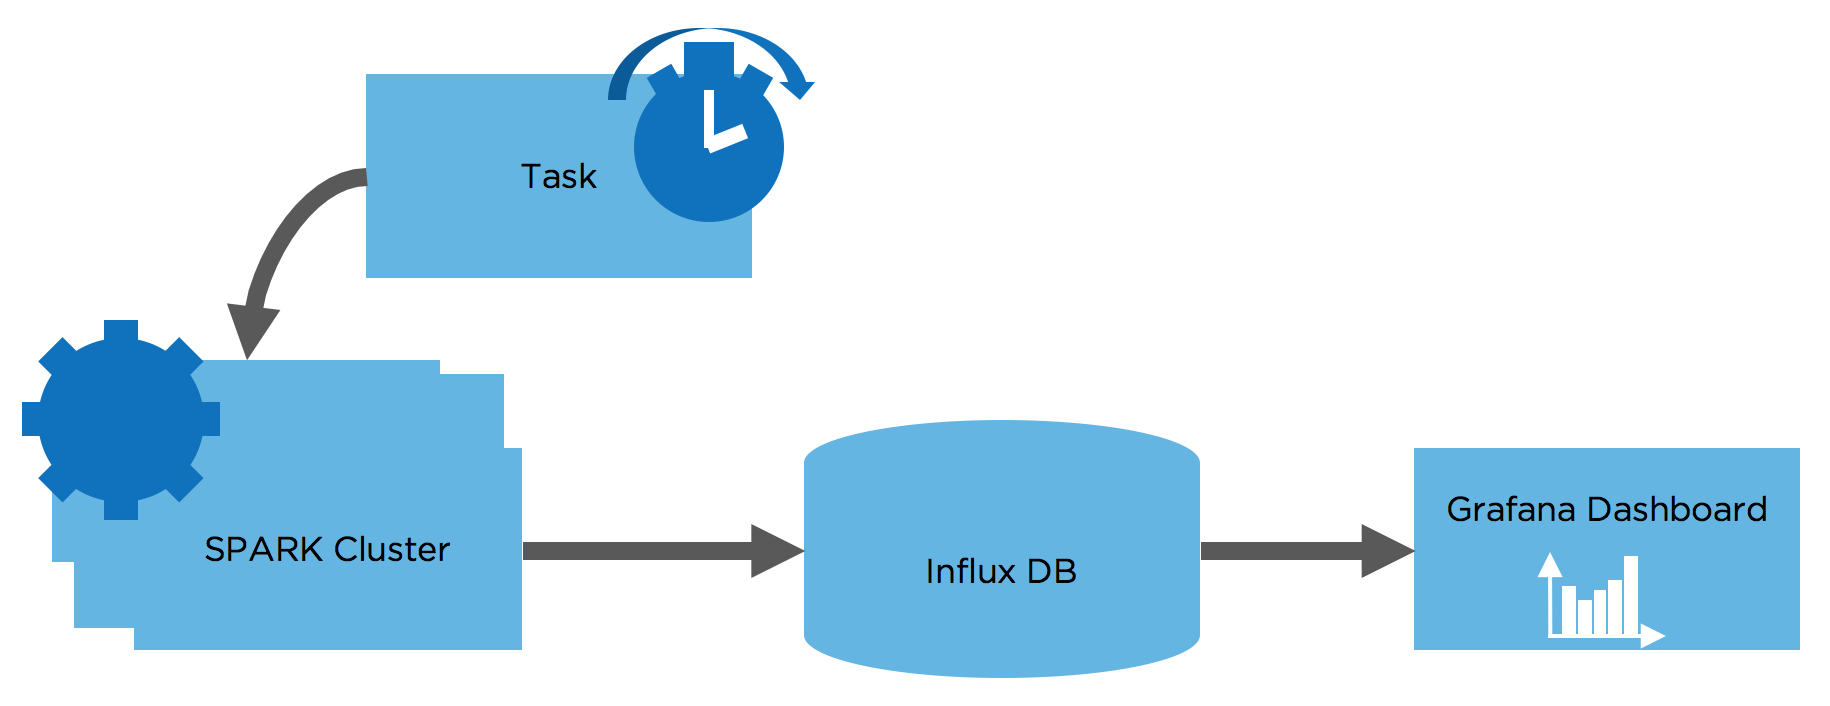
The flow:
- PEACH task is running by a task executor regularly to calculate the metrics based on collected events. After being calculated metrics are stored in InfluxDB.
- InfluxDB is open source time series database which is used to store the metrics.
- Grafana is open source web application which allows to query and to visualize data from differnet sources including InfluxDB.
Metrics calculation
There is existing pipe task which provides generic metrics for all organisations participating in the project.
In case custom metrics are required separate task should be created. Check pipe-task documentation for the details.
You can see the example for metric calculation here
InfluxDB schema
It is important to understand key concepts of InfluxDB described here.
Also check the guidelines on schema design
For example, The generic metrics algorithm provides next information:
- Measurement event_types with tags codops, metric and one field - value. Contains metrics about number of different event types collected per organisation.
Dashboard example
InfluxDB datasource plugin is used to connect Grafana with InfluxDB. More info can be found here. Also you can see the documentation about InfluxDB query language here.
After you have access to the Dashboard you can try to import this dashboard. Provide codops (for example, zzebu) during import process and you will see basic dashboard.

Account
If you would like to get an account to access https://peach.ebu.io/dashboards, please, contact the PEACH team.