The ops dashboard
Every codops has its own dashboard at
https://<codops>.peach.ebu.io
and, where a development environment exists, a second one at
https://<codops>-dev.peach.ebu.io. They are separate deployments: each one
only ever shows its own codops and its own environment, so there is no chooser
to get wrong.
It is the place to answer the everyday questions — what tag is running, did last night's task succeed, why is that endpoint slow, are events still arriving — and the place to promote a tag to production or roll one back. Everything on it is read-only unless you have admin rights.
Signing in
The dashboard sits behind the same GitLab forward-authentication as the rest of your codops' web surfaces, so an EBU GitLab account with access to your codops is all you need — no separate password. Sign-in happens at the edge, before the application sees the request; your identity and your GitLab groups are what the page uses to decide what to show you.
If you land on a page that is not yours you get a plain 403 naming the group
to ask for, rather than a blank screen.
Read-only and admin
A read-only pill next to the codops name means you can see everything but change nothing: Deploy new tag is disabled, and so is saving secrets. Admin rights come from being on your codops' admin list — either an explicit list of email addresses or one or more GitLab groups, configured per codops by the PEACH team. Codops that have set neither leave every authenticated user able to deploy; ask the PEACH team if you want the tighter gate.
Pages also disappear when the service behind them is not enabled for your codops, so a tab a colleague on another codops has may simply not exist on yours. That is deliberate — an empty page that can never fill up is worse than no page.
Overview
The landing page. A Daily / Weekly toggle at the top right switches every total, sparkline and chart bucket between the last 24 hours and the last 7 days; the rate and latency figures in the tables are always over the last 5 minutes.
Three cards summarise the state: Endpoints (how many, how many healthy, and current requests per second), Tasks (total, scheduled, running, and failed — the card turns red when something failed) and Events (volume over the selected range, with the change against the previous period).
The deploy card
Below the cards sits the currently running tag, when it was deployed and by
whom. Hovering it opens the detail: the commit behind the tag, and the source
repos that went into the build with a DRIFT marker on any repository whose
branch has moved past the SHA that was built — the usual explanation for "my
change is merged but not live".
Deploy log lists recent deploys for this codops and environment with their tag, who ran them and how they finished.
Deploy new tag (admin only) lists recent tags with their commit messages. Promoting the tag you have been running in dev and rolling back to an earlier one are the same operation — pick the tag you want. While a deploy is running the card turns into a progress state and the button is disabled.
Two interfaces, one mechanism
/ops in your ops-<codops> Slack channel does the same thing, showing dev
and prod side by side with a Promote button. See
Promotion and rollback.
If the live tag cannot be read from your codops' API the card says so plainly and falls back to the last tag recorded in the deploy log, rather than showing nothing.
Endpoints
One row per Ray Serve endpoint, with:
| Column | Meaning |
|---|---|
| Traffic | Request rate — per second down to 0.1/s, per minute below that, so low traffic does not round away to zero |
| Errors | Errors as a share of requests: raised exceptions plus gateway timeouts. Below 0.1 req/s a share would mislead, so a plain count is shown instead |
| Fallback rate | Share of requests served by the fallback path rather than the primary model, split into empty (benign: no results), timeout and error |
| p50 / p95 | Median and 95th-percentile request latency |
Only the timeout and error part of the fallback rate is treated as a problem; an endpoint that legitimately has nothing to return for some users will show a healthy-looking empty share. Active only hides endpoints scaled to zero.
Expanding a row opens everything the platform knows about that endpoint:
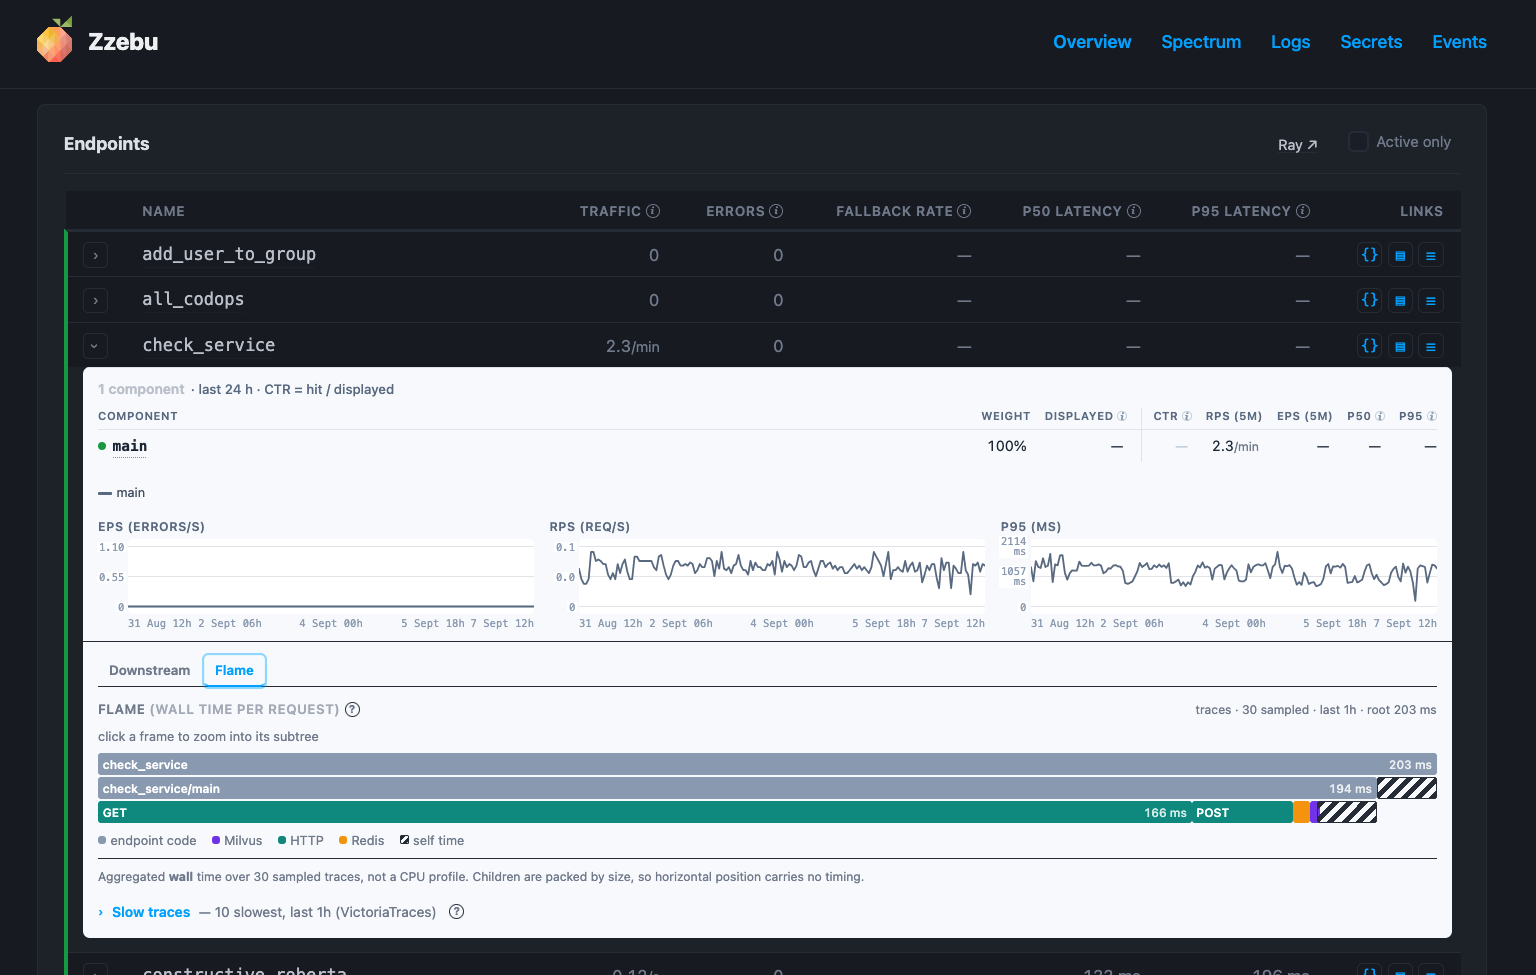
At the top is the component table. Endpoints that run several components behind one name carry an A/B badge, and each variant gets its own row: its traffic weight, how often it was displayed, its CTR (plays ÷ displayed over the last 24 hours, with the winning variant in green) and its own rate and latency figures. Single-component endpoints show the same row without the A/B framing.
Below that, errors, requests and p95 latency are charted over the selected range.
Where the time goes
The last part of an expanded row explains why an endpoint is as fast or slow as it is, from OpenTelemetry traces sampled over the last hour. It appears for codops that emit traces; the rest see a short note saying so rather than an empty panel.
Downstream breaks the request down by dependency — Milvus, Redis, HTTP calls out — with calls per request, p95 and the share of total time each accounts for. self time is the remainder: your own code, not covered by any downstream span.
Flame folds every span of the sampled batch into one tree, so you can see where time goes inside your code and not merely which dependency it landed in. Each frame's width is its share of the average request; hatched blocks are a frame's self time; clicking a frame zooms into its subtree.
The flame graph is not a timeline
Children are packed by size, not by when they ran, so horizontal position carries no timing. It is aggregated wall time over sampled traces, not a CPU profile. For ordering — what actually ran when, and what was waiting on what — open Slow traces, which lists the ten slowest requests of the window as span waterfalls, with the matching log lines alongside each one.
The row also links out to the endpoint's API URL and its page in the Ray dashboard, and can show the Python dependency snapshot for a tag, diffed against another tag — the fastest way to explain a behaviour change that no code change accounts for.
Tasks
One row per Prefect deployment: its schedule in words, the last ten runs as coloured bars (green success, red failed, blue running), when it last ran and how long it took. Hovering a bar gives the run detail; clicking it opens that run in Prefect.
Task rows expand into the same downstream, flame and slow-run panels as endpoints, over a 24-hour window rather than an hour — tasks run hourly or daily, so an hour would usually be empty.
Events
Incoming event volume for the selected range, broken down by event type, each with its own series and current rate. This is the pipe-collect side of the pipeline — if a type stops arriving here, nothing downstream will have it either.
Spectrum
A place to call your recommendation endpoints and look at what they actually return, side by side.
Pick one or more endpoints, then give them a seed: a random content item, a specific content ID, a user ID, or free text. Each endpoint gets its own lane, timed independently, so a slow or failing one does not hide the others — errors surface as a badge on that lane alone. Endpoints that cannot accept the current input mode are marked skipped or defaults rather than silently returning nonsense.
Results are enriched from CODEX, so you see titles, images and publication dates instead of bare IDs — where your codops has a CODEX token; if it does not, the IDs still render. Any result can be zoomed for the full item, or opened in a debug view showing the raw JSON the endpoint returned.
Setting a user ID also opens a user history lane showing what that user has consumed, which is the context you usually want when judging whether a personalised result is any good. User groups let you save named sets of test users so you can come back to the same cohort after a change; creating and editing groups requires admin.
Members that have no compute of their own and run on a shared deployment also get an Org selector, which switches the identity that content and history resolve against without changing which deployment is being called.
Logs
The Ray Serve logs for your codops, searchable by free text, level, source and time window — the HTTP access log, the per-deployment replica logs, and the driver output of task runs. The same view is available inline against a single trace on the Overview page, joined by request ID, which is usually the faster route when you already know which request went wrong.
Only Ray Serve logs are shipped, and only for codops whose Ray pods run the log-shipping sidecar. Where that is not enabled the page does not appear.
Secrets
The key/value pairs available to your endpoints and tasks as environment variables — API keys, tokens, credentials for third-party services. Values are masked until you tick Show values, and the page records who last changed them and when.
Reading and writing both require admin. See Secret handler for how a key reaches your code and what belongs in the store.
Saving is not enough
A saved value travels from AWS Secrets Manager to the cluster on its own, but your running pods keep the values they started with. The dashboard is explicit about this and offers Save and redeploy, which saves, waits for the cluster to actually have the new values, and then redeploys the current tag. Saving alone is fine — just remember the change is not live until the next deploy.
Events section
Grouped under Events in the top navigation, the pages that deal with the event pipeline rather than the serving side. Which of them you see depends on what is enabled for your codops and on your rights.
Schemas — the registered schema for each of your event types with its compatibility mode, plus an Open in AKHQ link into the shared Kafka UI (which only ever shows you your own topics).
Failures — events the pipeline could not accept: malformed JSON, values that do not fit the schema, produce failures. They are kept on your codops' dead-letter topic; the page shows the total, a breakdown by failure kind and the most recent envelopes including the payload that was rejected. A badge on the tab appears as soon as the count is non-zero.
Queries — an ad-hoc SQL editor against your codops' event tables in StarRocks, with schema browsing, autocompletion, per-codops query history, pinned queries and CSV/TSV export. This one is restricted to the PEACH core team; see Querying event data for the routes open to everyone.
Rollups — pre-aggregated materialised views over your event tables, on a refresh schedule. Superset charts pointed at a rollup rather than the raw table load in well under a second instead of tens of seconds. The page lists the existing rollups with their refresh state, row counts and last error, and its create form builds the definition for you: pick source event types, pick dimensions (with sampled cardinality shown, so an unwise grouping column is visible before you commit), pick a measure and a cadence, and see the estimated rows per day and storage before creating it.
Re-ingest — pulls one of your raw event topics back through the ingestion bridge so it lands in a queryable table, for a source that was never ingested in the first place. You can only ever select topics that belong to your own codops.
Retention — how long event data is kept, on two independent knobs. Kafka retention bounds how far back raw events can be replayed or re-ingested; StarRocks retention bounds the queryable analytics window and may deliberately be the longer of the two. Both are shown per event type alongside the window that is actually live.
GDPR — right-to-erasure and right-of-access over your StarRocks event data.
Because the subject key is not the same column in every table — event schemas
are generated per codops, so it may be user_id in one and client_id or
session_id in another — you map each table to its own key column, then scan
to see per-table match counts before anything is deleted. Erasure writes a
proof-of-erasure audit entry that stores a hash of the subject value rather than
the value itself. The access side gathers one subject's rows into a downloadable
archive; the raw identifier never appears in a filename, URL or log.
This page is gated more tightly than the rest: real admin rights, with no non-admin preview.
Footer
Every page ends with direct links into Grafana,
Ray and Prefect for
your codops, the running version of the dashboard itself, and a light/dark
toggle. The theme choice follows you across every *.peach.ebu.io tool, not
just this one.
Where to go next
- Going to Production — how a push becomes a tag, and how a tag becomes a deploy.
- Build your first feature — the round trip this dashboard is the last step of.
- Querying event data — the supported ways to read your event data.
- CODEX — the metadata store behind the enriched Spectrum results.